I am a graduate student and have just come into contact with the field of computational neuroscience. My major is biomedical engineering, and my programming ability is very limited. In the process of using NEURON, I encountered some problems.
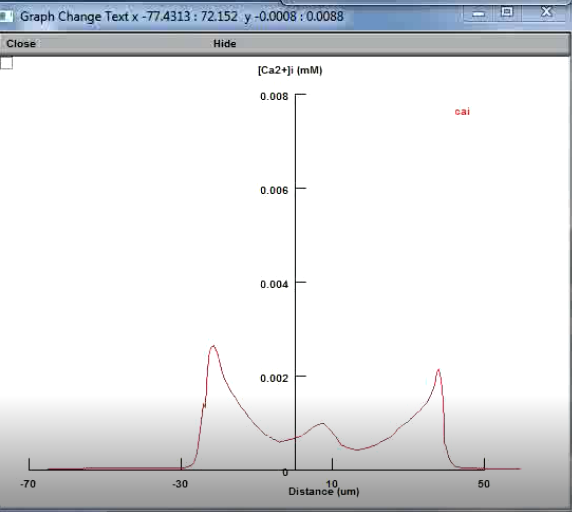
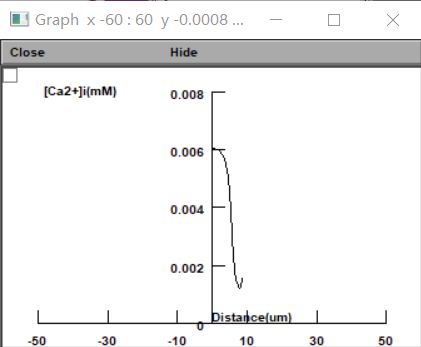
Recently I am learning calcium dynamics of astrocytes. Not long ago I read an article "Disentangling astroglial physiology with a realistic cell model in silico". This article systematically incorporate multi-scale, tri-dimensional astroglial architecture into a realistic multi-compartmental cell model, which constrain by empirical tests and integrate into the NEURON computational biophysical environment. One of the functions on display is of great interest to me, although it seems easy to implement. I want to get a graph of the concentration of calcium ions varying with distance during the transmission of calcium waves, as shown in the first figure. How to use the soma as the origin and draw the changes on both sides of the soma. In my own attempts, the results always show the concentration changes on the positive half axis (the second figure). I think there is a problem with my code, and I would like to ask you specifically.
The code is very simple, maybe it is easy to spot the mistake.
//The code is written by imitating similar code in some models, and my programming base was really poor. ╥﹏╥...
removeIfExists(flush_list, graphCaWaveCai)
graphCaWaveCai = new Graph()
flush_list.append(graphCaWaveCai)
graphCaWaveCai.size(-50, 50, 0, 0.008)
graphCaWaveCai.xaxis()
graphCaWaveCai.label(0.5, 0.09, "Distance(um)", 2, 1, 0, 0, 1)
graphCaWaveCai.label(0.1, 0.9, "[Ca2+]i(mM)", 2, 1, 0, 0, 1)
CaWaveCaiplot=new RangeVarPlot("cai")
soma CaWaveCaiplot.begin(0)
dendrite CaWaveCaiplot.end(1)
graphCaWaveCai.addobject(CaWaveCaiplot, 1, 1, 1, 1)
Thank you so much in advance for the help!
Best,
Langzhou