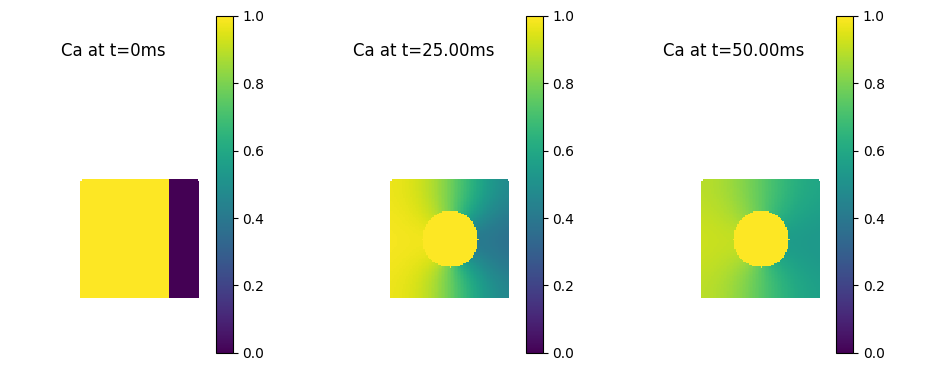
Sorry for the late response. A feature that was present for extracellular 3d (allowing voxels to have independent diffusion coefficients) was initially omitted form intracellular 3d. It has now been added (in the development branch;
https://github.com/neuronsimulator/nrn). Using that it is possible to exclude a region in intracellular 3d by setting the diffusion coefficient to zero. For example;
Code: Select all
from neuron import h, rxd
from neuron.units import μm, ms, nM, mM, mV
from matplotlib import pyplot
import numpy as np
h.load_file('stdrun.hoc')

# model parameters
soma_diam = 20 * μm
nucleus_diam = 5 * μm
caDiff = 1 * μm**2/ms
dx = 0.25 * μm

# create a soma
soma = h.Section(name='soma')
soma.pt3dclear()
soma.pt3dadd(-10 * μm, 0, 0, 20 * μm)
soma.pt3dadd(10 * μm, 0, 0, 20 * μm)
soma.nseg = 11


def exclude(x, y, z, diam, value_outside, value_inside=0):
    """ Function returns value_outside if outside the diameter otherwise
        value_inside (defaults to zero)
    """

    if x**2 + y**2 <= diam**2:
        return value_inside
    return value_outside

# use 3d solver
rxd.set_solve_type(dimension=3)

# Where? -- create the region
cyt = rxd.Region(soma, name='cyt', nrn_region='i', dx=dx)

# What? -- create the species
# initial difference in concentration with a cylinder where nothing
# diffuses
ca = rxd.Species(cyt, name='ca', charge=2,
                 d=lambda x,y,z: exclude(x, y, z, nucleus_diam, caDiff),
                 initial=lambda nd: 1.0 * mM if nd.y3d < 5 else 60 * nM)


h.finitialize(-70 * mV)

# plot concentrations averaged over depth
ax = pyplot.subplot(1,3,1)
pyplot.imshow(np.nanmean(ca.nodes.value_to_grid(),2), vmax=1, vmin=0)
pyplot.title('Ca at t=0ms')
pyplot.colorbar()
ax.axis('off')

h.continuerun(25)

ax = pyplot.subplot(1,3,2)
pyplot.imshow(np.nanmean(ca.nodes.value_to_grid(),2), vmax=1, vmin=0)
pyplot.title('Ca at t={0:1.2f}ms'.format(h.t))
pyplot.colorbar()
ax.axis('off')

h.continuerun(50)

ax = pyplot.subplot(1,3,3)
pyplot.imshow(np.nanmean(ca.nodes.value_to_grid(),2), vmax=1, vmin=0)
pyplot.title('Ca at t={0:1.2f}ms'.format(h.t))
pyplot.colorbar()
ax.axis('off')
pyplot.tight_layout()
pyplot.show()