A. Test the MRF
We click on the MRF's Error Value button and . . . nothing happens.
The value displayed in the adjacent field is still 0.
But we remember from the first tutorial that we need to
tell the MRF to use our generator--
and the iclamp Run Fitness Generator still has a little - (minus) sign in front of its name.
Once again, the steps are the same as in the first tutorial.
Now a + (plus sign) appears next to "iclamp" in the MRF's right panel. This tells us that the iclamp Run Fitness generator is on, so when we click on the MRF's Error Value button, the iclamp Run Fitness Generator will contribute to the total error value that appears in MRF's error value field.
So we click on the MRF's Error Value button, and a nonzero value does appear in the Error Value field. This confirms that we're using the iclamp generator.
This is another good time to save the MRF to a session file.
In code.zip you will find init_iclampopt.hoc and all of the hoc and ses files that it needs to recreate the unoptimized model, current clamp "virtual experimental rig," and Multiple Run Fitter, exactly as they should be at this point of the tutorial. Just use NEURON to execute init_iclampopt.hoc
B. Choose and use an optimization algorithm
This is very similar to the first tutorial.

C. Problems and pitfalls
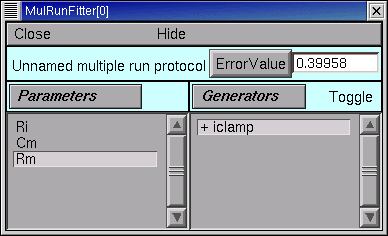
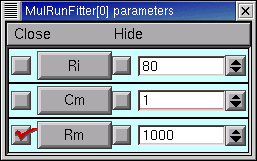
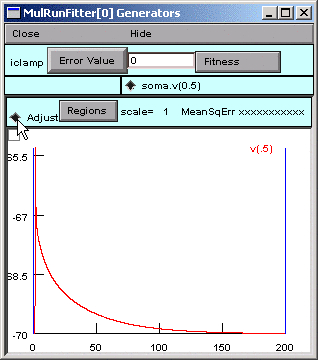
Before the first optimization, we click on the MRF's Error Value button and note that the initial parameter values (Ri = 80, Cm = 1, Rm = 1000) give an error of 0.39958. Then we click on the Optimize button, and several iterations flash by in the Generator. For a while there doesn't seem to be much improvement, but eventually the optimizer stops. Although the error value has decreased somewhat, there still seems to be quite a way to go.
Dauntless, we press ahead, clicking again on Optimize. Another series runs flash by, leaving the voltage trace looking much better. One more click on Optimize and it seems we're stuck in a local minimum, with the black trace in the iclamp Run Fitness Generator hardly changing from run to run.
But what of our results?
Rm looks acceptable (if a bit low) at 14481 ohm cm2,
and when we type rn() at the oc> prompt,
we get 157.9155, which is close to the experimentally measured 153 megohms.
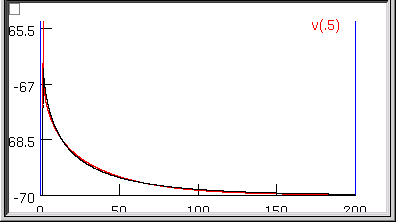
Also, the overall time course of the model's Vm trajectory looks like a close match
to the experimental data.
However, Ri and Cm are unbelievable--13613 ohm cm and 3.9156 uf/cm2 ! What went wrong?
Examining the first 5 ms of the model's soma.vm(0.5) trajectory, we see that it doesn't really capture the early time course of the experimental data.
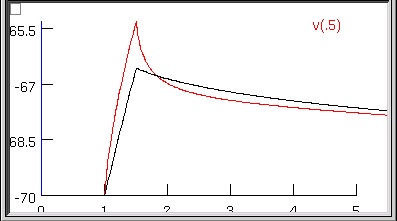
This really shouldn't be much of a surprise. Basically we performed a blind curve fitting operation on data that stretches over 200 ms. When you think about it that way, the black trace is really a pretty good fit to the original data. We may know that the first few milliseconds of the charging curve contains most of the information that is useful for determining Ri and Cm, but the optimizer algorithm is ignorant of that fact, and gives the error at each data point equal consideration. Therefore the early part of the charging transient is treated like an inconsequential blip, and the fit is dominated by the long, slow decay phase.
So much for blind reliance on an algorithm. Time to use what we know, or can reasonably surmise.
A minimal principled strategy
Let's try something very simple. For example, the initial values of Ri (80 ohm cm) and Cm (1 uf/cm2) are in the right ballpark, but Rm (1000 ohm cm2) is probably far too small. So why don't we follow the minimal strategy described by this pseudocode?
  REPEAT
    optimize Rm only
    optimize Ri and Cm only
  UNTIL done
With a little effort we could be a lot more clever--e.g.
we might apply a greater weight to errors computed during
the early part of the charging curve,
as described in the Hints at the bottom of this page--but
first let's see how far this minimal strategy takes us.
To keep track of how well we're doing,
we'll monitor the MRF's error value
and the values of Rm, Ri, Cm, and rn(), making sure that they converge.
The checkboxes to the left of the parameter buttons in the Parameter Panel allow us to specify which parameters will be adjusted by the optimizer, and which will remain constant. When the Parameter panel is first brought up, all of these checkboxes are checked, which means that adjustment of all parameters is enabled.
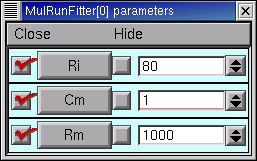
Clicking on one of these checkboxes toggles adjustment of the corresponding parameter between ON (check present) and OFF (no check). Here's how the Parameter Panel should look before we start the first optimization on Rm :
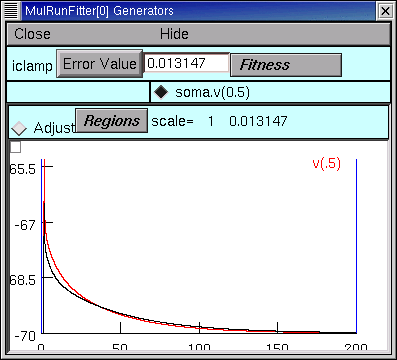
After the 9th quad form with Ri and Cm constant, the error seems to have settled at 0.013147, with Rm = 44123 ohm cm2, RN = 150.07105, and the MRF looks like this
This seems a propitious moment to disable adjustment of Rm and enable adjustment of Ri and Cm
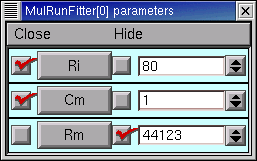
and try optimizing the latter parameters.
Over the next two quad forms the error plummets rapidly, and by the 12th quad form it seems to come to rest at 7.1536e-5, with Ri = 137.96, Cm = 0.83841, Rm = 44123, and RN = 153.35106. The simulated transient is also visibly much closer to the experimental data (see for yourself).
At this point, what say we bet the farm--enable adjustment of all parameters--Ri, Cm, and Rm--and see if we can squeeze out a bit more error reduction? No triskaidekaphobia here!
The 13th quad form returns with the simulated transient visually indistinguishable from the experimental data (the red trace is hidden behind the black trace)
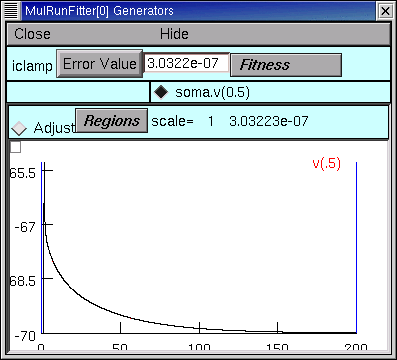
even when we zoom in on the first few milliseconds.
The error fell to 3.0322e-7--by more than two orders of magnitude--and the model's parameters are now Ri = 155.76 ohm cm, Cm = 0.85852 uf/cm2, and Rm = 43060 ohm cm2, and the model's input resistance is 153.38781.
Now clicking on the Optimize button causes the error, parameters, and RN to merely bounce around in their last few decimal places. This might matter if it made sense to aim at three place accuracy or better, but we know that two place accuracy is about as good as you can get from charging curves. We are compelled by our natural modesty and discretion to conclude that Ri ~ 156 ohm cm, Cm ~ 0.86 uf/cm2, and Rm ~ 43000 ohm cm2.
What about dirty data?
Charging curves are subject to several kinds of problems, the most serious being contamination of the early time course by electrode and amplifier artifacts (under- and overcompensation of electrode capacitance and series resistance). This can interfere with the accuracy of Ri estimates. Disappearance of the late decay phase into baseline noise may also happen.
Want to try dealing with these problems?
1. Contamination of the early response
This forces us to abandon the data collected during current injection and for a (hopefully) brief time afterwards.
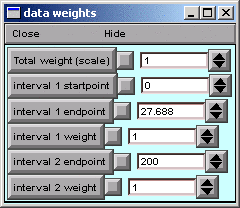
For example, suppose we know that electrode artifact persists for 0.5 ms after the end of current injection. Then we want to restrict the range of time over which the optimizer computes its error, in order to avoid the contaminated data.
We can use the Weight panel to do this.
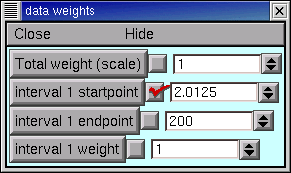
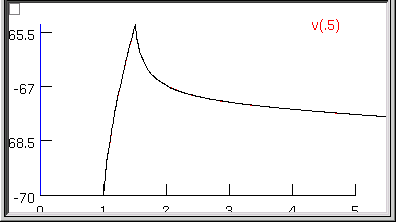
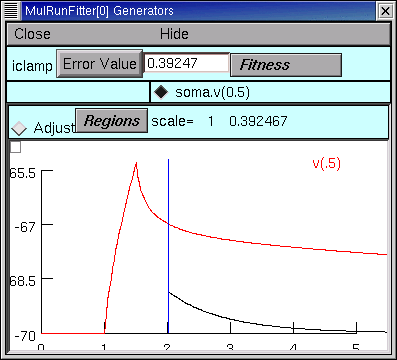
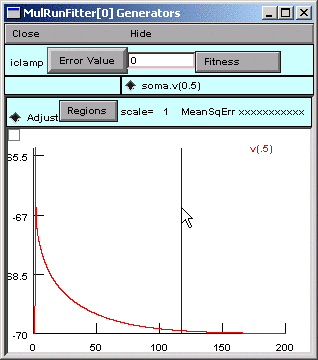
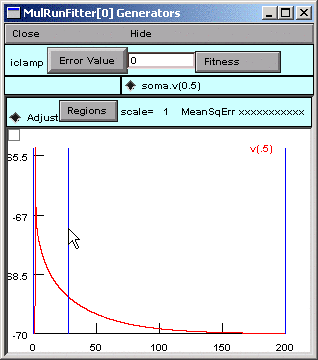
The MRF's graph provides visual confirmation that the left edge of interval 1 now starts at 2 ms (vertical blue line). Clicking on the Error Value button makes the error calculation, and plot of simulation results, begin at the new starting point (black trace).
Here's the challenge :
Restore the original values of Ri, Cm, and Rm (80, 1, 1000),
and try to optimize the model while ignoring the contaminated data.
It's a safe bet that, the later the "interval 1 startpoint" becomes,
the poorer the fit will be, especially the value of Ri--but how late
does the startpoint have to be, before fitting becomes a guessing game?
2. Contamination of the late response
Try reducing "interval 1 endpoint" and see how this affects the fit. Intuition suggests that, for this model, the fit should be fairly good unless the endpoint is < 100 ms.
Merely click on the "Adjust" radio button.
Click on one of the region boundaries and drag it to a new location. This is equivalent to specifying the interval startpoints and endpoints in the Weight panel.
Click on the canvas, and a new region boundary will appear at that location.
Reposition it as you like by dragging, or by using the Weight panel.
To merge adjacent regions, click on the region boundary that separates them, and drag it to the right or left until it collides with one of the other region boundaries. That's all there is to it.
Copyright © 2012 by N.T. Carnevale and M.L. Hines, All Rights Reserved.