However, now look what happens (2D scatter graphs) when I add a rate reaction.
The first graph here is with solve set to 1D.
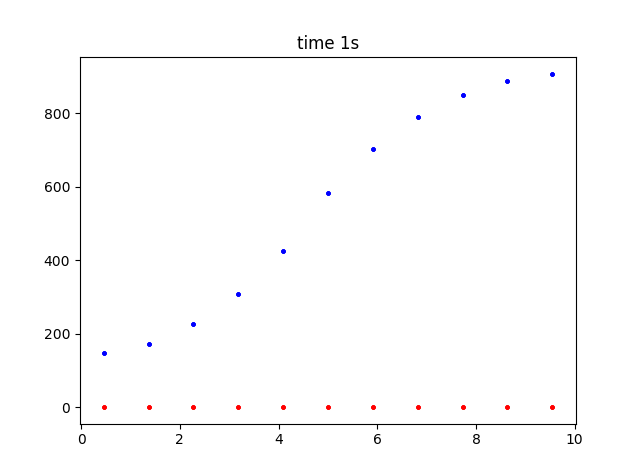
There is a dear buildup of substance where it is being produced by the rate reaction. (Red is time zero, blue after 1 second).
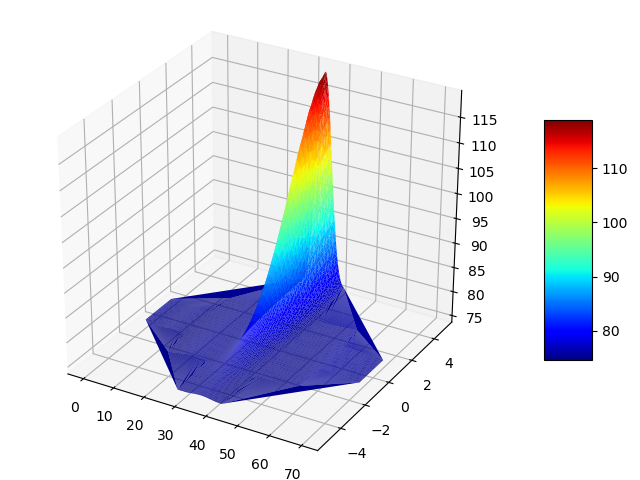
If I simply change solve type to 3D, I expect to see the same build up of substance in the R.H.S.? see below, I do not.
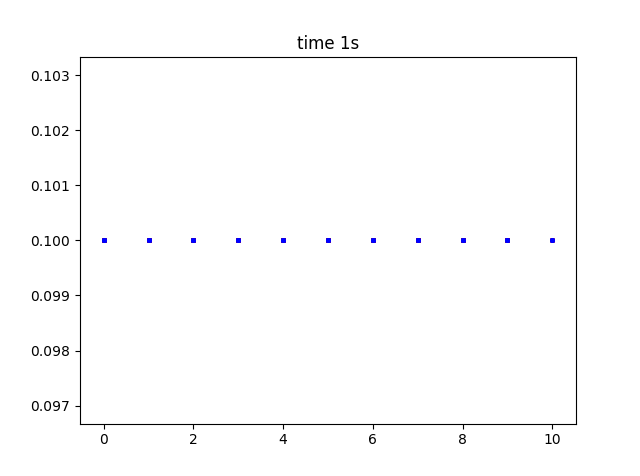
There seem to be no parameters I can use, where species build up when produced by a rate or reaction. I am so sorry, any idea what I an doing wrong? code below:
Code: Select all
# -*- coding: utf-8 -*-
"""
Created on Mon Jan 21 19:54:56 2019

@author: Richard
"""

from neuron import h, rxd
from matplotlib import pyplot

# needed for standard run system
h.load_file('stdrun.hoc')

left = h.Section(name='left')

left.nseg= 11
left.L = 10
left.diam= 5

tfact=1.000
rxd.set_solve_type(dimension=3)
#rxd.nthreads(8)
cytosol = rxd.Region(h.allsec(),dx=1)#change dx here.. default 0.25
ctfact = rxd.Species(cytosol, d=.01, initial=0.1)

def right_only(node):
    return 1 if node.x3d > left.L/2 else 0

production_region = rxd.Parameter(cytosol, initial=right_only)
reaction = rxd.Rate(ctfact, 1* production_region)
print('about to finalize')
h.finitialize(-60)
print('finalized')

def plot_it(color='b'):
    print('plotting')
    y = ctfact.nodes.concentration
    x = [node.x3d for node in ctfact.nodes]
    pyplot.scatter(x, y, marker='o', color=color, s=5)

# plot the initial situation
plot_it('r')

# we will plot every 25ms up to 100ms
h.continuerun(1000)
plot_it()
pyplot.title('time {}s'.format(1))
pyplot.show()